|
 |
 Автор: Williams Автор: Williams
 Дата: 18 мая 2025 Дата: 18 мая 2025
 Просмотров: 358 Просмотров: 358 |
| |
Schlumberger Waterloo Hydrogeologic Visual MODFLOW Flex v11.0
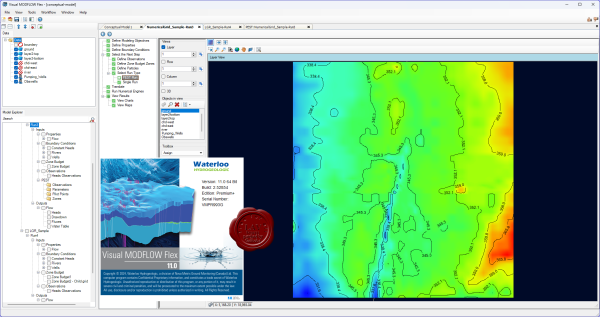
Visual MODFLOW Flex is the industry standard software for 3D groundwater flow, heat and contaminant transport modeling.
- Integrated Conceptual and Numerical Groundwater Modeling
- Powerful 2D and 3D Visualization Capabilities
- Intuitive and Easy-to-Use
Более побдробно тут |
| |
 Читать статью дальше (комментариев - 5)
| |
|
 |
 Автор: Williams Автор: Williams
 Дата: 17 мая 2025 Дата: 17 мая 2025
 Просмотров: 1 672 Просмотров: 1 672 |
| |
CYPE Ingenieros CYPE 2026.a Multilingual (online installer)
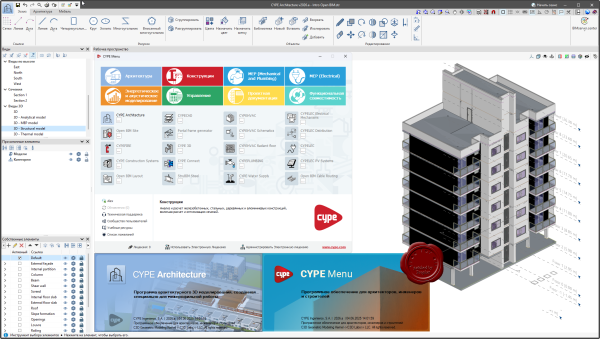
CYPE programs have a wide range of national and international codes available which are applied to carry out the analysis, design and check of reinforced concrete, rolled steel, welded steel, cold-formed steel, composite, aluminium and timber structures for gravitational, wind, seismic and snow loads.
CYPE's building services programs contain design codes which are used to analyse and design building services (water supply, waste water, air conditioning, solar capture for hot sanitary water, lightning protection, lighting, gas, electricity and telecommunication installations), and to check thermal and acoustic insulation, the building's energy certification and fire safety.
CYPECAD - program that carries out the analysis and design of reinforced concrete and steel structures, subject to horizontal and vertical loads, for homes, buildings and civil work projects. Its use guarantees maximum analysis reliability and optimum drawing design. The geometry of the structure can be introduced automatically. The user can personalise the design and edit the elements that have been introduced, with the on-screen support provided: numerous help options and error and warning texts. Provides very complete and precise construction drawings of the structure. CYPECAD is adapted to the latest national and international construction codes.
CYPE 3D - it is an agile and efficient program brought about to carry out the design of three dimensional structures composed of steel and timber bars, and their foundations, which includes pad footings, pile caps and strap and tie beams. Additionally, these can be redesigned and so obtain their maximum optimisation. It has been adapted to national and international steel, timber, aluminium and concrete construction codes. The program carries out the analysis, design and check of the fire resistance of timber sections. Performs a seismic analysis of the structure (Modal Spectral Analysis) according to national and international codes. Second order effects (P-delta) are considered with wind and seismic loads.
CYPE-Connect - the program can check slabs with or without transverse punching shear reinforcement, takes into account the presence of openings or lightweight zones in the slab, and the position of the supports (internal, edge or corner). Punching shear verification is a program that checks the Failure Limit State of concrete for punching shear in flat and waffle slabs exposed to concentrated loads from rectangular or circular supports. ]
Вниманию российских проектировщиков: программный комплекс CYPECAD получил сертификат соответствия №0896268 требованиям нормативных документов:
- СП 20.13330.2011 Нагрузки и воздействия Актуализированная редакция СНиП 2.01.07-85
- СП 63.13330.2012 Бетонные и железобетонные конструкции. Актуализированная редакция СНиП 52-101-2003
- СП 14.13330.2011 Строительство в сейсмических районах. Актуализированная редакция СНиП II-7-81
|
| |
 Читать статью дальше (комментариев - 14)
| |
|
 |
 Автор: Williams Автор: Williams
 Дата: 16 мая 2025 Дата: 16 мая 2025
 Просмотров: 116 Просмотров: 116 |
| |
Cydarex CYDAR Professional 2025 v8.3.2.6
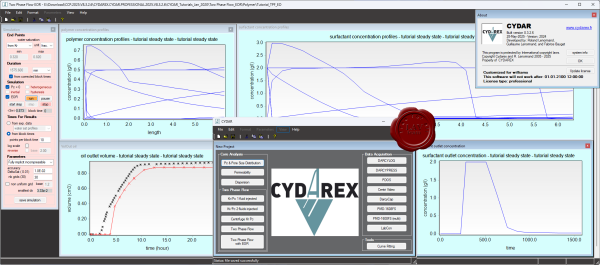
CYDAR software, a product of Cydarex, is a specialized tool for analyzing SCAL data on cores and cuttings in petroleum engineering. This software interprets SCAL (Special Core Analysis) tests on cores and cuttings to examine important parameters such as permeability, capillary pressure, electrical properties, and oil recovery. CYDAR, using the latest methods and techniques, provides high accuracy and efficiency in reservoir simulation and analysis.
CYDAR also includes several modules, each designed for specific analyses, including mercury injection and withdrawal (MICP), absolute and relative permeability calculations, centrifuge tests, and electrical measurements. With a user-friendly interface and comprehensive database, CYDAR provides automated and accurate reporting. In addition, the ability to integrate with other software and provide output in a variety of formats is one of the outstanding features of CYDAR. |
| |
 Читать статью дальше (комментариев - 0)
| |
|
 |
 Автор: Williams Автор: Williams
 Дата: 15 мая 2025 Дата: 15 мая 2025
 Просмотров: 215 Просмотров: 215 |
| |
ACI Services eRCM Thermo 2024 v1.10.2.0
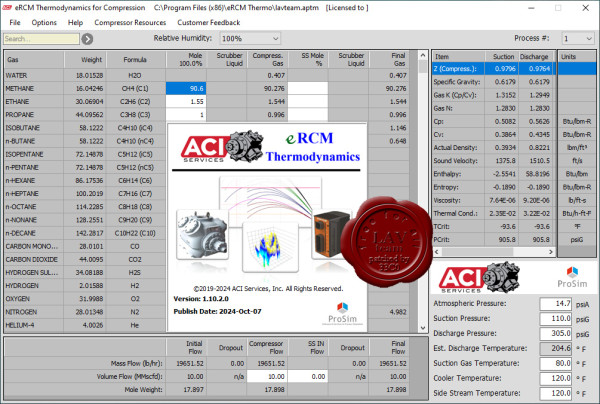
Calculating accurate compressor performance requires accurate thermodynamics. eRCM Thermo integrates ProSim’s Simulis Thermodynamics, allowing gas mixture modeling from nearly 400 individual gas components.
Once a gas/gas mixture is entered, eRCM Thermo dynamically calculates: Gas K (via CP/CV), Gas K (via balanced entropy), Compressibility (Z) factors, Specific Gravity and Density, Water Saturation, Hydrocarbon Liquid Dropouts, Phase envelope curves, Water drop out curves, Hydrate formation curves, Gas Mixing (e.g. from a side stream in), Speed of sound through gas, Variety of Units, And more, like Enthalpy and Entropy. |
| |
 Читать статью дальше (комментариев - 0)
| |
|
 |
 Автор: Williams Автор: Williams
 Дата: 14 мая 2025 Дата: 14 мая 2025
 Просмотров: 168 Просмотров: 168 |
| |
ACI Services eRCM Pro 2025 v1.27.2.0
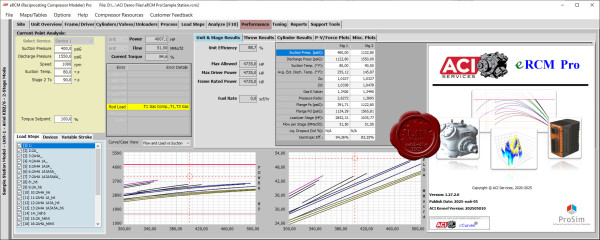
eRCM Pro replaces the highly successful eRCM Reciprocating Compressor Modeling Software, which enjoyed a twenty-year journey of helping end users model, tune, reapply, and configure their reciprocating compressors.
With so many compressors, so many performance methods, so many PLC implementations and so many restrictions for safe use, ACI’s eRCM Modeling Software provides the ideal solution to model compressor performance.
Simply specify the compressor’s geometry (frame, cylinder, stage, throw, valving, etc.) via direct inputs or by importing data from OEM software, and eRCM Pro displays that unit’s performance curves: Pressure vs. Load, Pressure vs. Flow, Pressure vs. Pressure and more, including graphs of net rod load forces, PV/PT cards, Torque Effort, and more.
Operating conditions change. Will adding a 500 inі clearance pocket to a cylinder’s head end give enough unloading to accommodate the new operating map? Within seconds you’ll have your answer via eRCM Pro.
Tired of Gas Control using one method to predict unit performance, while engineers use another, and the PLC/operators are using yet another method to actually control the hardware? eRCM provides one methodology for disciplines within your company.
Want to see if the packager’s unloading sequence can be improved? With eRCM Pro you can easily check any combination of volume pockets and end deactivation. Including adding spacers to increase fixed clearances or adding filler pieces to volume pockets to decrease additional clearances. You can even check safety at Start Up, and check safety if certain valves fail.
No compressor performance program would be complete without the ability to improve your models. eRCM Pro does just this. Enter valid analyzer data in the tuning section, and eRCM Pro will auto-adapt the performance predictions to accommodate the real-world effects of pulsation, actual valve and parasitic losses, friction losses, etc.
eRCM Pro features:
- Model entire stations
- Manage previous versions of your models
- Fully International aware interface
- Impressive list of Units of Measure
- Advanced thermodynamic calculations using ProSim now included – full support for 400 gases with liquid dropouts
- Still, the fastest performance and graphs in the industry
- As you expect with eRCM, fully dynamic compressor performance, PV cards, Force Plots, Torque Effort Plots, etc.
- Advanced support for Side Streams and Gas Mixing
- Improved valve modeling
- Improved gas preheat modeling
- Improved Load Step Sequence creation
- Full tables, curves, and 3D plot generation
- Support for Clearance devices, End Deactivation devices, Timed-valve Closing devices, Gas Stepless devices, and even variable stroke devices
|
| |
 Читать статью дальше (комментариев - 0)
| |
|
 |
 Автор: Williams Автор: Williams
 Дата: 13 мая 2025 Дата: 13 мая 2025
 Просмотров: 160 Просмотров: 160 |
| |
Schrodinger Suite 2025-2
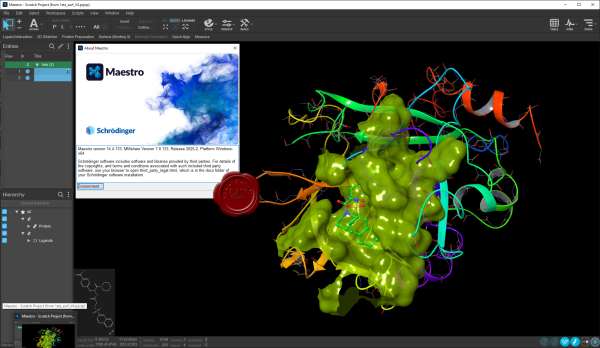
Schrodinger is a scientific leader in computational chemistry, providing software solutions and services for life sciences and materials research. Schrodinger aims to provide integrated software solutions and services that truly meet its customers' needs. We want to empower researchers around the world to achieve their goals of improving human health and quality of life through advanced computational techniques that transform the way chemists design compounds and materials. By building and deploying breakthrough scientific software solutions and forming collaborations and partnerships, we help scientists accelerate their research and development activities, reduce costs, and make novel discoveries that might otherwise not be possible.
Schrodinger software suite is a drug design software using both ligand and structure-based methods. Schrodinger provides accurate, reliable, and high performance computational technology to solve real-world problems in life science research. It provides superior solutions and services for the design, selection, and optimization of novel drug candidates. Schrodinger's predictive models will enable drug discovery scientists to assess properties of chemical compounds early in the discovery process and to select drug candidates that have optimal profiles. The predictive power of Schrodinger's software allows scientists to accelerate their research and development activities, reduce research costs, and make novel discoveries that might not be possible with other computational or experimental approaches. |
| |
 Читать статью дальше (комментариев - 0)
| |
|
 |
 Автор: Williams Автор: Williams
 Дата: 12 мая 2025 Дата: 12 мая 2025
 Просмотров: 146 Просмотров: 146 |
| |
Dassault Systemes BIOVIA TmoleX 2023.1
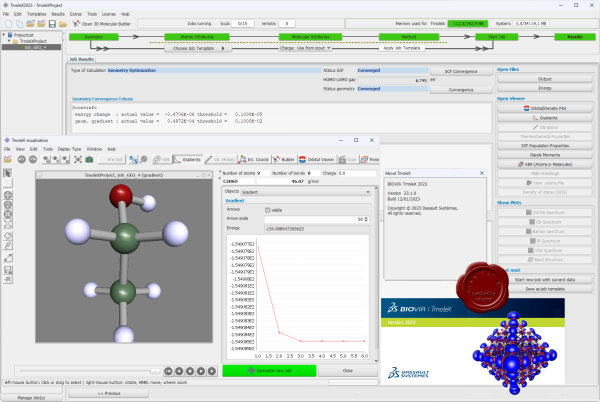
Modeling & Simulation of Molecules and Crystals.
We herein present the graphical user interface (GUI) TmoleX for the quantum chemical program package TURBOMOLE. TmoleX allows users to execute the complete workflow of a quantum chemical investigation from the initial building of a structure to the visualization of the results in a user friendly graphical front end. The purpose of TmoleX is to make TURBOMOLE easy to use and to provide a high degree of flexibility. Hence, it should be a valuable tool for most users from beginners to experts. The program is developed in Java and runs on Linux, Windows, and Mac platforms. It can be used to run calculations on local desktops as well as on remote computers. |
| |
 Читать статью дальше (комментариев - 4)
| |
|
 |
 Автор: Williams Автор: Williams
 Дата: 11 мая 2025 Дата: 11 мая 2025
 Просмотров: 1 993 Просмотров: 1 993 |
| |
Adobe Acrobat Pro 2025 v25.1.20521 Multilingual x32+x64
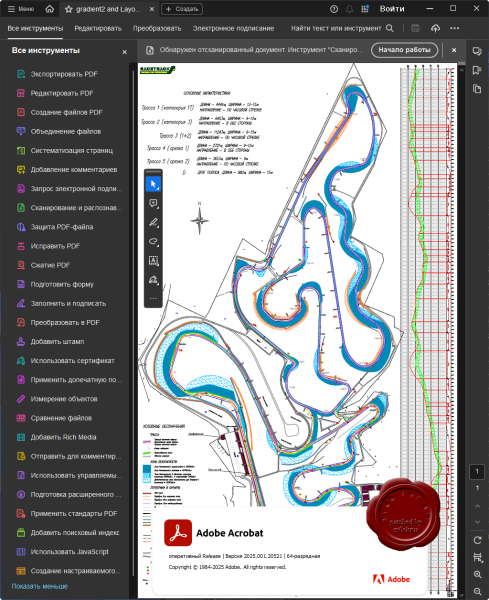
Adobe Acrobat — пакет программ, выпускаемый с 1993 года компанией Adobe Systems и предназначенный для создания и просмотра электронных публикаций в формате PDF.
С помощью утилиты легко отредактировать документы, преобразовать их в другой формат или внести изменения. Данный формат считается довольно сложным для корректировки, но с помощью качественного программного обеспечения упрощается процесс работы.
Программа включает множество инструментов для преобразования и редактирования документов PDF, а также добавления в них подписей. Вы можете использовать его где угодно. Начните создавать документ в офисе, откорректируйте его по пути домой и отправьте финальную версию на утверждение уже из дома - это просто, быстро и удобно. |
| |
 Читать статью дальше (комментариев - 14)
| |
|
 |
 Автор: Williams Автор: Williams
 Дата: 10 мая 2025 Дата: 10 мая 2025
 Просмотров: 1 071 Просмотров: 1 071 |
| |
CSI ETABS v22.6.0 build 4035
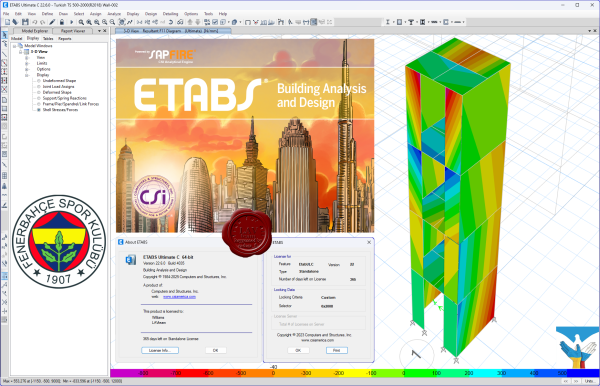
The innovative and revolutionary new ETABS is the ultimate integrated software package for the structural analysis and design of buildings. Incorporating 40 years of continuous research and development, this latest ETABS offers unmatched 3D object based modeling and visualization tools, blazingly fast linear and nonlinear analytical power, sophisticated and comprehensive design capabilities for a wide-range of materials, and insightful graphic displays, reports, and schematic drawings that allow users to quickly and easily decipher and understand analysis and design results.
From the start of design conception through the production of schematic drawings, ETABS integrates every aspect of the engineering design process. Creation of models has never been easier - intuitive drawing commands allow for the rapid generation of floor and elevation framing. CAD drawings can be converted directly into ETABS models or used as templates onto which ETABS objects may be overlaid. The state-of-the-art SAPFire 64-bit solver allows extremely large and complex models to be rapidly analyzed, and supports nonlinear modeling techniques such as construction sequencing and time effects (e.g., creep and shrinkage). Design of steel and concrete frames (with automated optimization), composite beams, composite columns, steel joists, and concrete and masonry shear walls is included, as is the capacity check for steel connections and base plates. Models may be realistically rendered, and all results can be shown directly on the structure. Comprehensive and customizable reports are available for all analysis and design output, and schematic construction drawings of framing plans, schedules, details, and cross-sections may be generated for concrete and steel structures.
ETABS provides an unequaled suite of tools for structural engineers designing buildings, whether they are working on one-story industrial structures or the tallest commercial high-rises. Immensely capable, yet easy-to-use, has been the hallmark of ETABS since its introduction decades ago, and this latest release continues that tradition by providing engineers with the technologically-advanced, yet intuitive, software they require to be their most productive. |
| |
 Читать статью дальше (комментариев - 12)
| |
|
 |
 Автор: Williams Автор: Williams
 Дата: 9 мая 2025 Дата: 9 мая 2025
 Просмотров: 592 Просмотров: 592 |
| |
CSI SAFE v22.6.0 build 3146
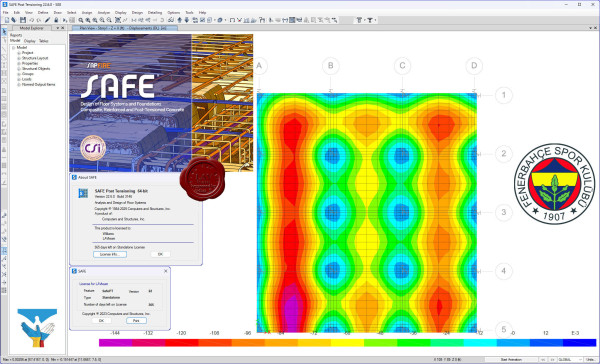
CSI SAFE - программный комплекс для проектирования железобетонных перекрытий, фундаментов и фундаментных плит. Каждый аспект процесса проектирования конструкций, от создания геометрии конструкции до выпуска чертежей, интегрирован в одну простую и интуитивно понятную рабочую среду ПК SAFE. Создание модели производится с использованием интеллектуальных инструментов рисования, или с использованием опций импорта из CAD-системы, электронных таблиц или базы данных. Плиты или фундаменты могут быть любой формы и могут иметь круглые и криволинейные очертания. Как в плитах, так и в балках, может быть смоделировано пост-напряжение (натяжение на бетон). Плиты перекрытий могут быть плоскими, а также иметь ребра в одном или в обоих направлениях. В модель могут быть включены колонны, связи, стены и наклонные плиты, соединяющие перекрытие с верхним и нижним перекрытиями. Стены могут быть смоделированы как прямолинейными, так и изогнутыми в плане. |
| |
 Читать статью дальше (комментариев - 5)
| |
|
 |
| ПОИСК ПО САЙТУ |
 |
|
 |
| КАЛЕНДАРЬ | | |
 |
| « Сентябрь 2025 » |
|---|
| Пн | Вт | Ср | Чт | Пт | Сб | Вс |
|---|
| 1 | 2 | 3 | 4 | 5 | 6 | 7 | | 8 | 9 | 10 | 11 | 12 | 13 | 14 | | 15 | 16 | 17 | 18 | 19 | 20 | 21 | | 22 | 23 | 24 | 25 | 26 | 27 | 28 | | 29 | 30 | |
|
 | |
| |
|