|
 |
 Автор: Williams Автор: Williams
 Дата: 4 января 2024 Дата: 4 января 2024
 Просмотров: 342 Просмотров: 342 |
| |
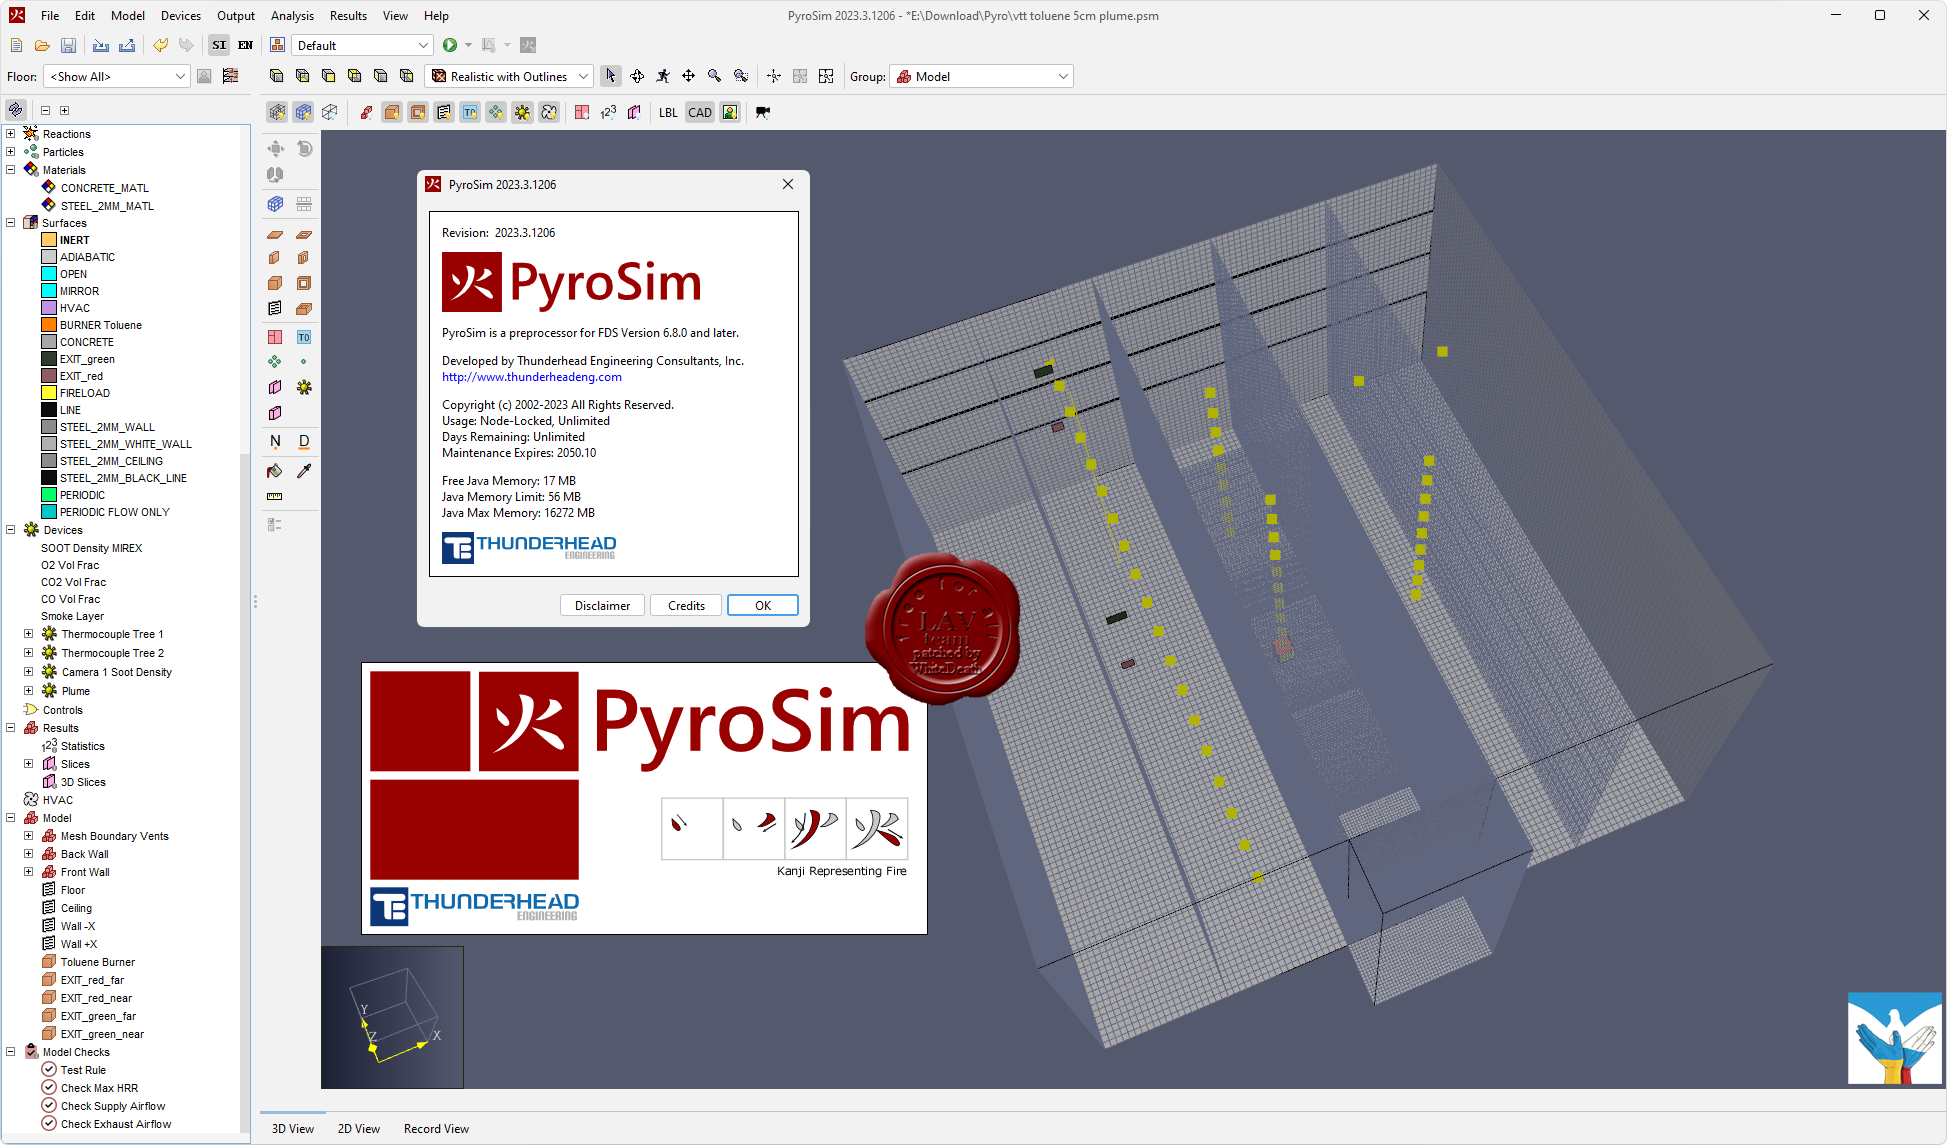
Thunderhead PyroSim 2023.3.1206
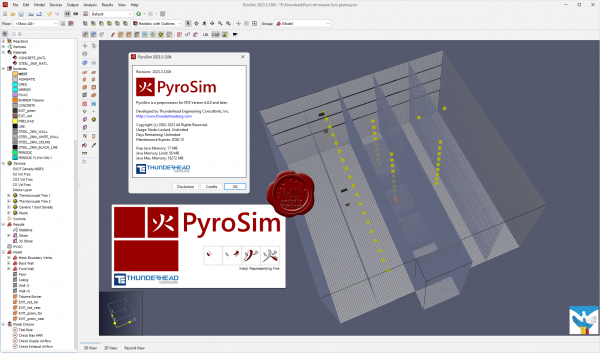 PyroSim – это пользовательский интерфейс для программы Fire Dynamics Simulator (FDS). Полевая модель FDS может предсказывать распространение дыма, температуры, угарного газа и других опасных факторов во время пожара. Результаты моделирования используются для обеспечения безопасности зданий при проектировании, определения безопасности существующих зданий, реконструкции пожаров при расследованиях, и помощи в тренировках пожарных. FDS – мощный инструмент для моделирования пожара, разработанный Национальным институтом стандартов и технологий (National Institute of Standards and Technology – NIST). FDS моделирует сценарии пожара с использованием вычислительной гидродинамики (CFD), оптимизированной для низкоскоростных температурно-зависимых потоков. Такой подход оказывается очень гибким, и может быть применен к различным пожарам, начиная от горения в печах и до пожаров на нефтяных танкерах. Также с помощью FDS может быть выполнено моделирование, не включающее горение, например, работа вентиляции в зданиях. Расчетная модель FDS и программа для визуализации Smokeview тесно встроены в PyroSim. PyroSim – это пользовательский интерфейс для программы Fire Dynamics Simulator (FDS). Полевая модель FDS может предсказывать распространение дыма, температуры, угарного газа и других опасных факторов во время пожара. Результаты моделирования используются для обеспечения безопасности зданий при проектировании, определения безопасности существующих зданий, реконструкции пожаров при расследованиях, и помощи в тренировках пожарных. FDS – мощный инструмент для моделирования пожара, разработанный Национальным институтом стандартов и технологий (National Institute of Standards and Technology – NIST). FDS моделирует сценарии пожара с использованием вычислительной гидродинамики (CFD), оптимизированной для низкоскоростных температурно-зависимых потоков. Такой подход оказывается очень гибким, и может быть применен к различным пожарам, начиная от горения в печах и до пожаров на нефтяных танкерах. Также с помощью FDS может быть выполнено моделирование, не включающее горение, например, работа вентиляции в зданиях. Расчетная модель FDS и программа для визуализации Smokeview тесно встроены в PyroSim.
Tutorials |
| |
 Читать статью дальше (комментариев - 2)
| |
|
|
Автор: Williams
Дата: 1 января 2024
Просмотров: 182 |
| |
Thunderhead Ventus 2023.2.1206
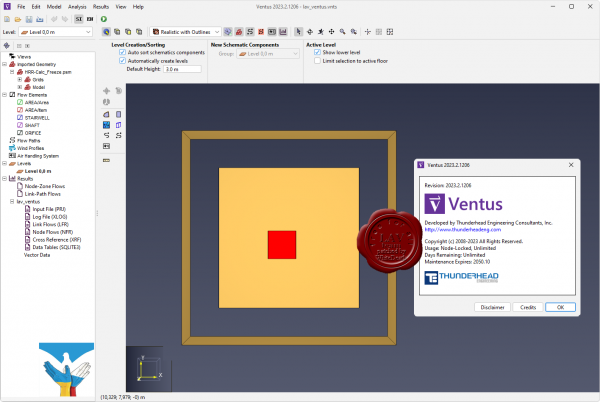
Ventus is designed to provide a pressurization simulation for smoke control analysis. The simulation is performed by CONTAM, an open-source application maintained and developed by NIST.
Like PyroSim and FDS, Ventus provides a premium user experience for industry leading simulation software. By utilizing our expertise in delivering 3D modeling applications for fire protection eningeering, Ventus will exceed the demands of CONTAM users who want to accelerate their smoke control projects.
- Ventus allows users to build 3D models of pressure zones based on actual building geometry.
- Ventus manages multi-variable scenarios for simplified batch CONTAM simulation and analysis.
- Ventus tabulates results data for multiple scenarios into digestible CSV data and 3D visuals.
- Whether for stairwells, atriums, or underground buildings, proper air handling systems must be designed for pressurized smoke control in case of emergency. Ventus provides a clear and efficient path from modeling a building to understanding temperatures, pressures, and densities so that the proper solution can be reached.
Thunderhead Engineering supports you every step of the way. Whether you want in-depth training or self-taught materials, you can learn performance-based design modeling with greater efficiency and proficiency. We design our software for anyone to learn, and our customers are delighted when our support team helps them succeed. |
| |
Читать статью дальше (комментариев - 3)
| |
|
|
Автор: Williams
Дата: 28 декабря 2023
Просмотров: 228 |
| |
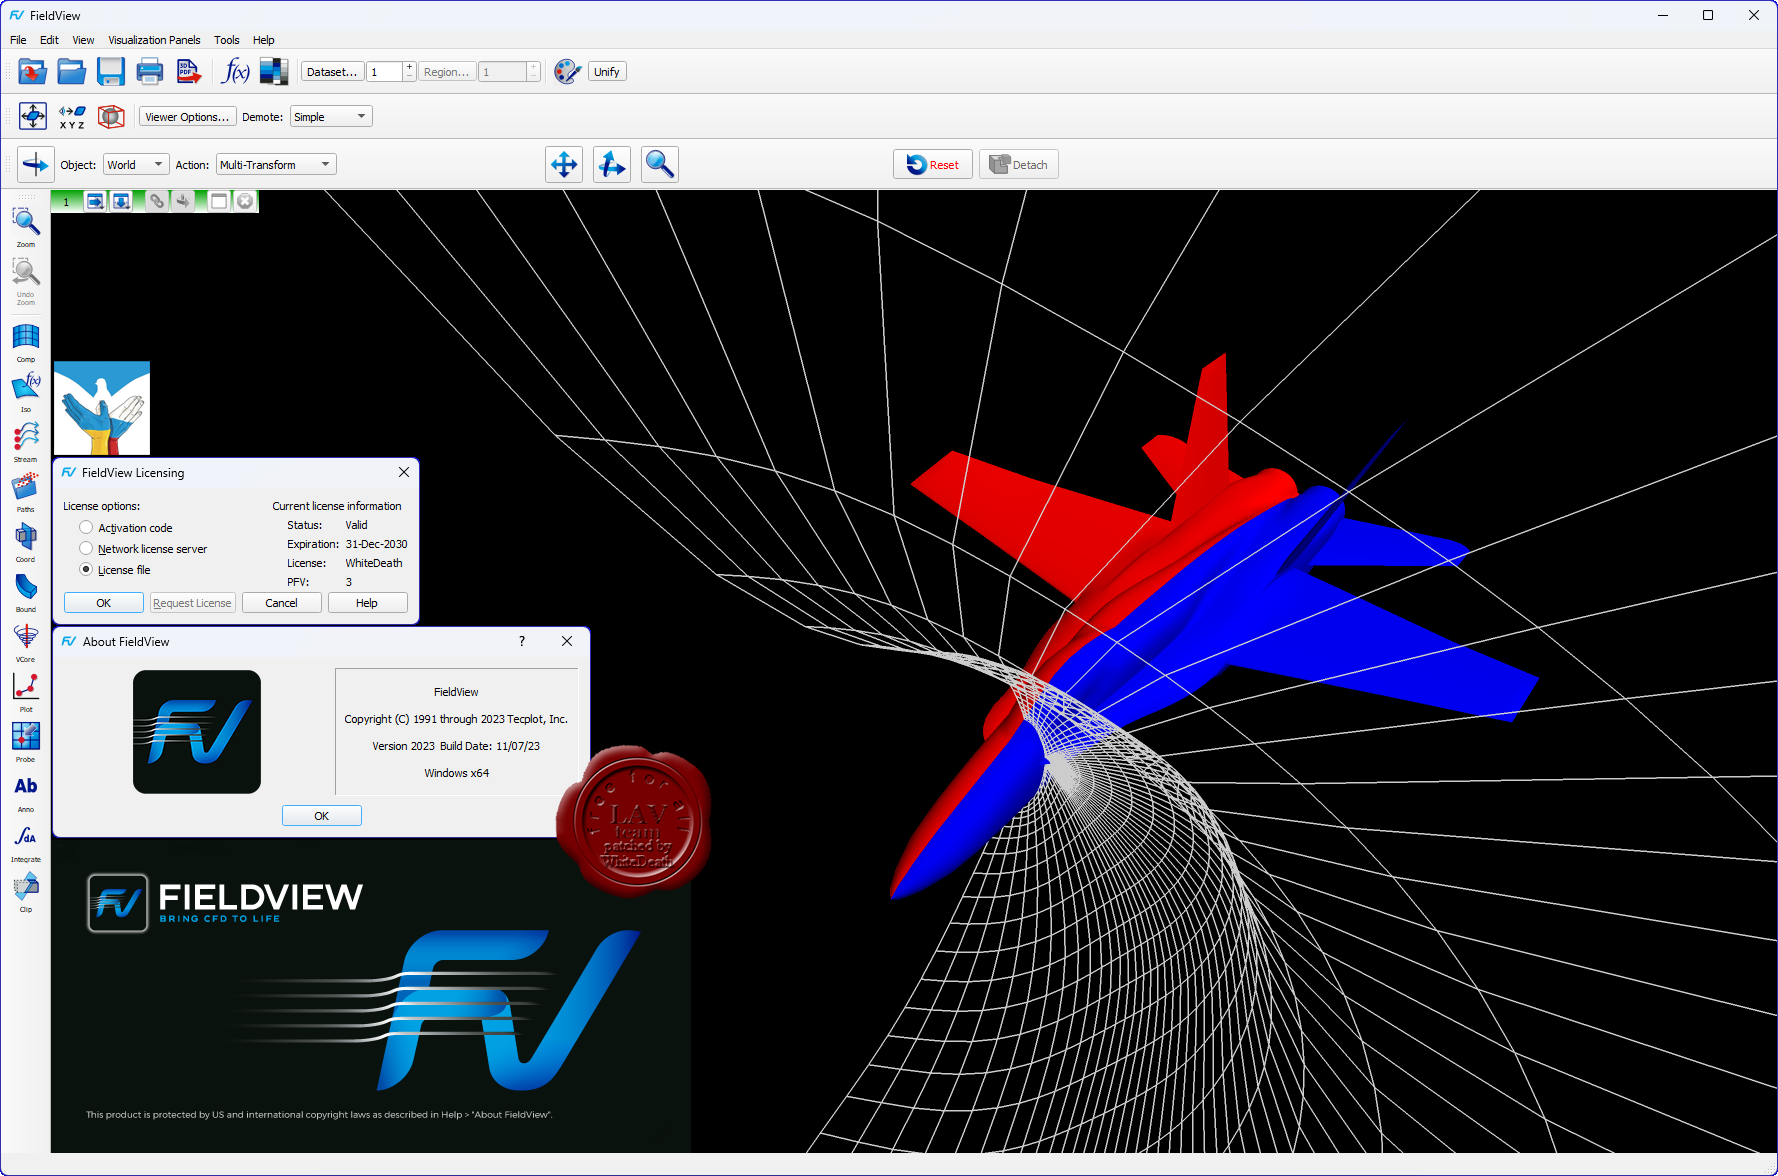
Tecplot FieldView 2023 build 11.07.2023

FieldView - Bring CFD to Life! The FieldView Postprocessor is the visualization and analysis tool of choice by engineers wanting to make better decisions quickly and with confidence.
Understand
- See what is happening at realistic (real world) speeds with fast interactive animation.
- Dig deeper with powerful yet easy to use feature extraction tools and predefined Q-criterion and λ2 functions.
- Compare with Dataset Sampling and Dataset Differencing to get quantitative and qualitative differences.
Communicate
- Bring CFD results to life with realistic images and animations that include environments, backgrounds, and materials.
- Increase confidence within your organization and with customers.
- Reveal important new information, make design decisions, avoid problems, and get to market faster.
Automate
- Reuse your work on new simulation results over and over.
- Post-process in full batch with python or FieldView’s own scripting language (FVX).
- Standardize repetitive tasks so any member of the team will get the same great results.
- Perform standard tasks overnight to get the answers you need first thing in the morning.
- Process many more cases than can be done by hand.
- Archive your process with your images, plots, and animations.
Whats new |
| |
Читать статью дальше (комментариев - 2)
| |
|
|
Автор: Williams
Дата: 25 декабря 2023
Просмотров: 257 |
| |
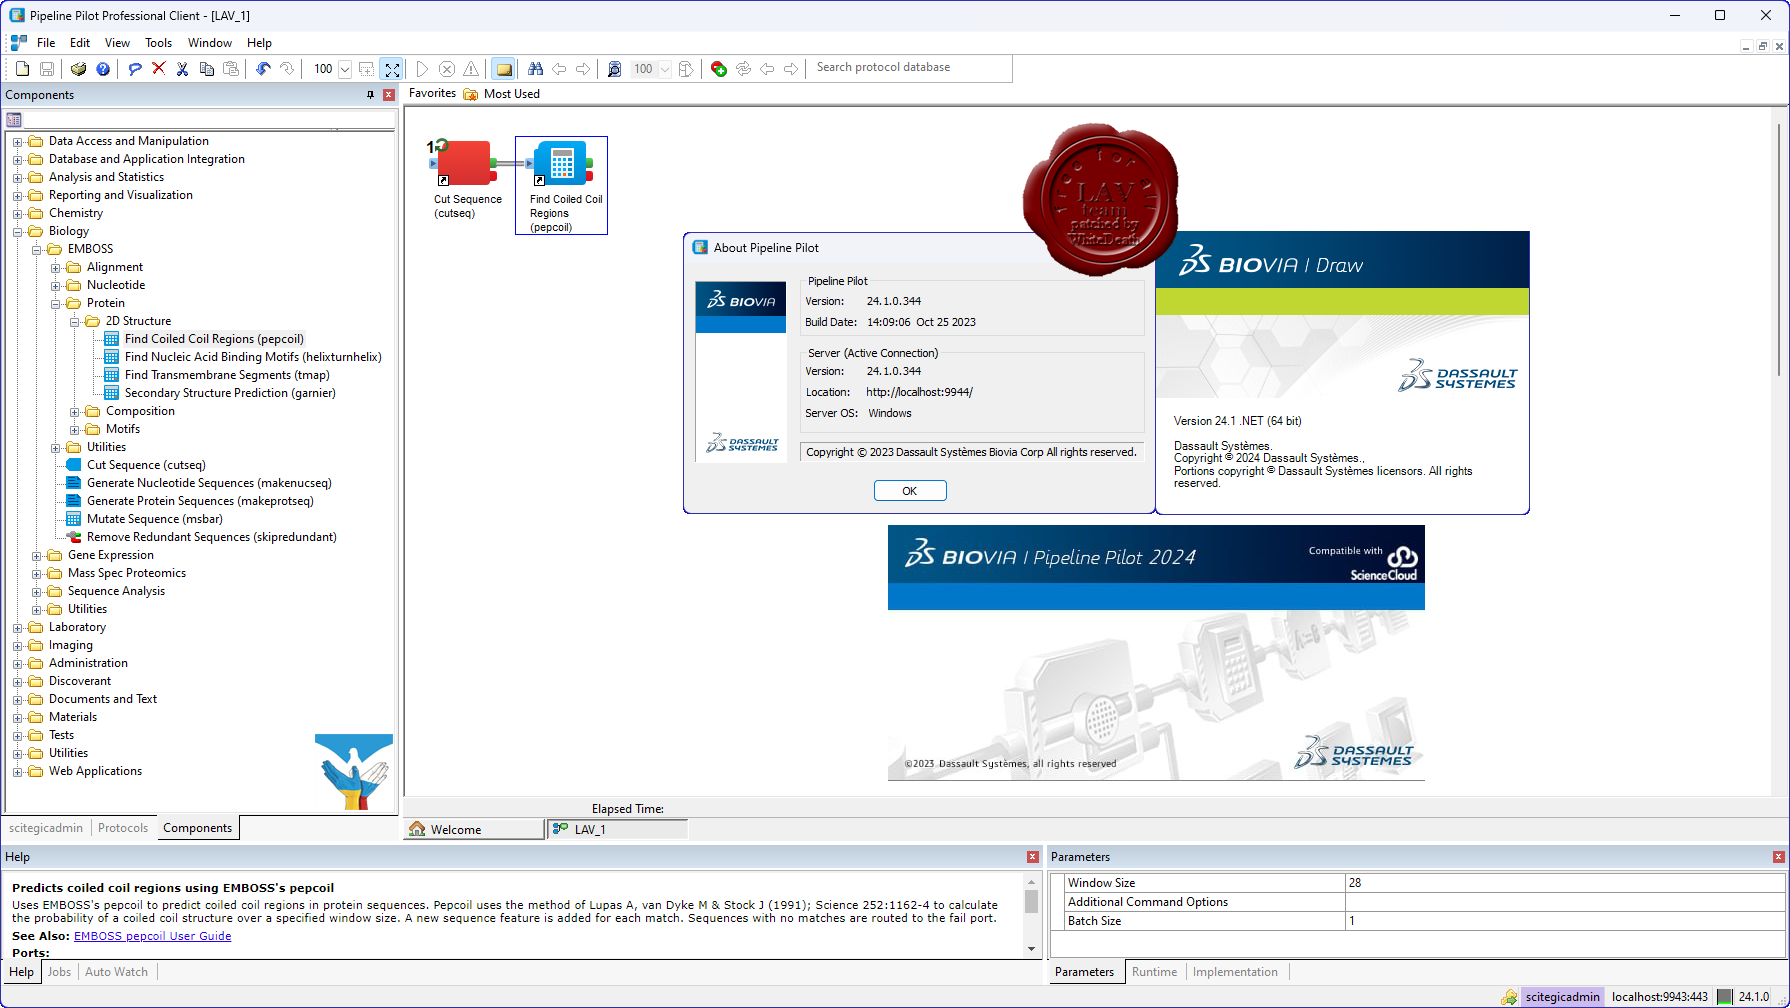
Dassault Systemes BIOVIA Pipeline Pilot 2024.1
 In the sciences community, there is a growing need for information technologies capable of manipulating and analyzing large quantities of data in real time. Every aspect of the R&D process is being industrialized, and the reliance on automated methods has dramatically altered the research environment. Research data is doubling in volume every 12 months, creating a flood of new data from both internal and external sources. This presents tremendous challenges in the integration, management, and analysis of this valuable data, and it has led to a gross underutilization of the data. In the sciences community, there is a growing need for information technologies capable of manipulating and analyzing large quantities of data in real time. Every aspect of the R&D process is being industrialized, and the reliance on automated methods has dramatically altered the research environment. Research data is doubling in volume every 12 months, creating a flood of new data from both internal and external sources. This presents tremendous challenges in the integration, management, and analysis of this valuable data, and it has led to a gross underutilization of the data.
Pipeline Pilot Client was designed with the vision that it is possible to address these challenges with a new approach to the way research data is handled and analyzed. This approach, known as "data pipelining", uses a data flow framework to describe the processing of data.
Data pipelining is the rapid, independent processing of data points through a branching network of computational steps. It has several advantages over conventional technologies, including:
- Flexibility: Each data point is processed independently, allowing processing to be tailored to each record.
- Speed: Highly optimized methods allow rapid, real-time analysis of thousands (or millions) of data points.
- Efficiency: Individual processing of data points limits memory use so that many protocols can be executed simultaneously.
- Ease of use: Protocols are easy to construct, with visualization that exposes key data processing steps.
- Integration: Data pipelining is a powerful tool for connecting the different data sources, databases, and applications required in a variety of scientific enterprises.
Pipeline Pilot provides environments to design, test, and deploy data processing procedures called protocols. A protocol comprises a set of components that perform operations such as data reading, calculation, merging, and filtering. The connections between components define the sequence in which data is processed. Data from files, databases, and the web is merged, compared, and processed, according to the logic of the protocol.
Constructing protocols is made easy with a graphical drag-and-drop interface. The work environment is divided into windows. On the left, the Explorer window shows the contents of the database of available components and prebuilt protocols. On the right, the workspace provides a way to create new protocols by dropping and connecting components.
A visual representation makes it simple to understand critical data processing steps in a potentially complicated procedure. Components are displayed as function-specific icons clearly identified with descriptive labels. Data records are passed between components through pipes represented by gray lines.
You can read data from databases or files, calculate new properties, filter records, and view results. You can save new protocols in the database of components and publish them for enterprise-wide sharing and reuse.
The best practices of your domain experts are automatically captured as they use Pipeline Pilot in their daily work. |
| |
Читать статью дальше (комментариев - 0)
| |
|
|
| ПОИСК ПО САЙТУ |
|
|
|
|