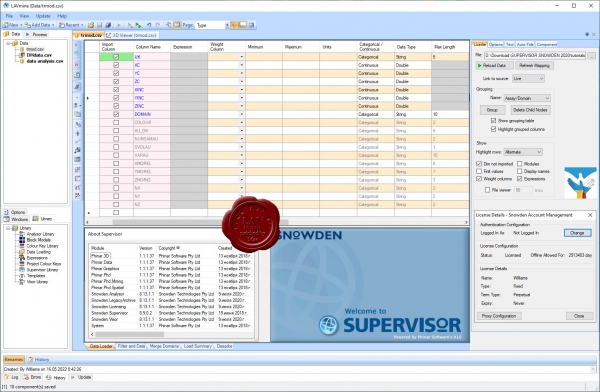
Snowden Technologies Snowden Supervisor v8.13.1.1

Supervisor is an invaluable tool for resource estimation professionals because it helps to solve practical geological issues in the shortest possible time. If you use biased data or invalid domains in your resource estimation process, you will get an unreliable result. This will have dramatic implications downstream in the mining value chain. Billions of dollars get invested based on resource estimates, so it is critical that they are as accurate as possible. Supervisor has a range of advanced features that leverage decades of research and experience in geological data analysis and geostatistics. It’s intuitive and easy to use because we’ve built it around how geologists need to work. This is why Supervisor is recognised as an industry leader in geological data analysis.
Supervisor has a range of data analysis tools that will allow the user to rapidly understand the characteristics of an orebody. Tools include: histograms, log probability plots, cumulative distribution functions, correlation matrices, Q-Q plots, box and whisker plots, mean and variance plots, as well as the application of top cuts and declustering.
Variograms represent the grade continuity within your deposit and are a key input to the kriging process. Supervisor’s easy to use variogram analysis is interactive, allowing the user to view and model variograms for all directions at once and view them in 3D.
Optimise block size and estimation parameters with an interactive and simple to use KNA interface to ensure a better quality estimate and reduce conditional bias (oversmoothing). KNA tests various block sizes, number of samples, search parameters and discretisation to ensure conditional bias is minimised.
Ensure the accuracy of your estimate against the input data in a fraction of the time and test the theoretical grade tonnage curve using global change of support. Model validation generates grade trend plots, histograms, log probability plots, statistics and global change of support to assess the quality of an estimate.
Determine the optimal drill hole spacing for your deposit by creating various theoretical drilling patterns and generating statistics for kriging efficiency and slope of regression. These statistics can then be compared for various drilling patterns and search parameters to determine which give the optimal results.
Test your variograms before running your estimate by using Supervisor’s cross validation module. This is done by comparing the ‘true’ sample grade with the estimated grade at each sample point and generating a scatterplot and associated statistics for analysis.